Traces
A trace is one coding-agent session: your prompts, the agent’s replies and the tool calls it made. Every file an agent opened, every command it ran and every approach it abandoned is in there, and none of it is easy to find once the terminal closes. kit keeps it.
hevd, the kit daemon, reads the session files your harnesses already write
and indexes new and growing ones into a Layer namespace. Search over that
namespace is hybrid: a semantic leg and a full-text (BM25) leg, fused in the
store. You can search from the terminal, a local web UI, a terminal browser,
or by asking Claude Code or Codex, which get a skill that searches for them.
What gets captured
hevd scans on an interval, every five minutes by default (scan_interval
under [capture] in ~/.hev/config.toml). It reads these sources:
| Harness | Source | --harness value |
|---|---|---|
| Claude Code | ~/.claude/projects | claude_code |
| Codex | ~/.codex/sessions | codex |
| pi | ~/.pi/agent/sessions | pi |
| dot | ~/.dot/traces | dot |
Sessions that run as part of a dispatched order carry the
order’s ID, so you can pull up every trace behind one piece of work with
--order.
Start capturing
hev up starts everything on one machine: the hev layer gateway and its store,
the dashboard, and hevd under launchd. It also installs the hev-traces skill
for Claude Code and Codex, whichever you have.
hev upBy default this is free and local. The gateway runs on Postgres in Docker, your
transcripts stay on this machine, and the namespace is hev-traces. To share
one archive with your team on hosted hev layer, export
a key before the first hev up:
export HEVLAYER_API_KEY=...
hev up
The key is saved in the config, so later runs need nothing exported. A machine
stays on the store its first hev up chose. hev up --store pgvector moves it back to
local, starting the new archive empty and indexing every transcript into it
again. Bringing your own turbopuffer account is an advanced option in
hev init.
To run the daemon on its own, use hev d (start it, or show status if it is
already running), hev s (status) and hev stop. hev down stops the
containers and unloads the daemon.
Index by hand
hevd indexes on its own. hev index does the same pass on demand, which is
useful for a first backfill or to see what a pass would write.
hev index                        # text and tool calls
hev index --tier all             # also tool results
hev index --limit 20 --dry-run   # parse and chunk without writing
Unchanged transcripts are skipped, and chunk IDs are content addressed, so
re-running is cheap and safe. Tool results are most of the bytes and the least
of what anyone searches for, so they are opt-in with --tier tool_result or
--tier all.
Search
hev traces search "why did the preflight fail"Type what you remember. kit searches prompts, replies and tool calls across every session and returns the chunks where the words turned up, with their session.
Add --also with another phrasing of the same question. Up to eight phrasings
go in one request and the store fuses them. Pair a natural-language phrasing
with the literal tokens you expect, such as an error string, a flag or a file
name: the semantic legs match meaning and the BM25 legs match exact words.
hev traces search "why did the preflight fail" --also "HEVLAYER_API_KEY 401"
hev traces search --since 7d --harness codex --json "flaky deploy"| Flag | Effect |
|---|---|
--also | Another phrasing, fused in the same request. Repeatable. |
--since | Only chunks from this window, such as 2h or 7d. |
--harness | Only one harness: claude_code, codex, dot or pi. |
--workdir | Only one working directory. |
--plan | Only one plan. |
--order | Only chunks from one dispatched order. |
--top | Number of results. Default 8. |
--json | Full chunk text with session and turn IDs, for scripts and agents. |
Scoping flags combine with AND.
Ask an agent
hev up installs the hev-traces skill, so Claude Code and Codex can search
your traces themselves. Ask “how did we fix the preflight failure last week?”
and the agent plans a few phrasings, runs them through hev traces search, and
reads the sessions around the best hits.
List and read traces
hev traces                       # sessions from the last day
hev traces list --since 5d
hev traces list 2026-10-30       # one day
hev traces list --order ORDER_ID
hev traces show 3f2a             # one trace, by session ID prefix
hev traces show --json 3f2a      # normalized turns as JSON
hev browse opens the same archive in an interactive terminal browser.
The web UI
hev up runs the dashboard at http://127.0.0.1:8099. On a machine without
Docker, or to serve a different namespace, run the read-side UI directly:
hev serve                        # http://127.0.0.1:8787
hev serve --port 9000 --namespace hev-traces
hev serve binds to 127.0.0.1 by default. --bind takes another address, for
example a private network address so a laptop can read a headless machine’s
archive. The server has no login, so only bind it where everyone who can reach
it may read every transcript.
Search
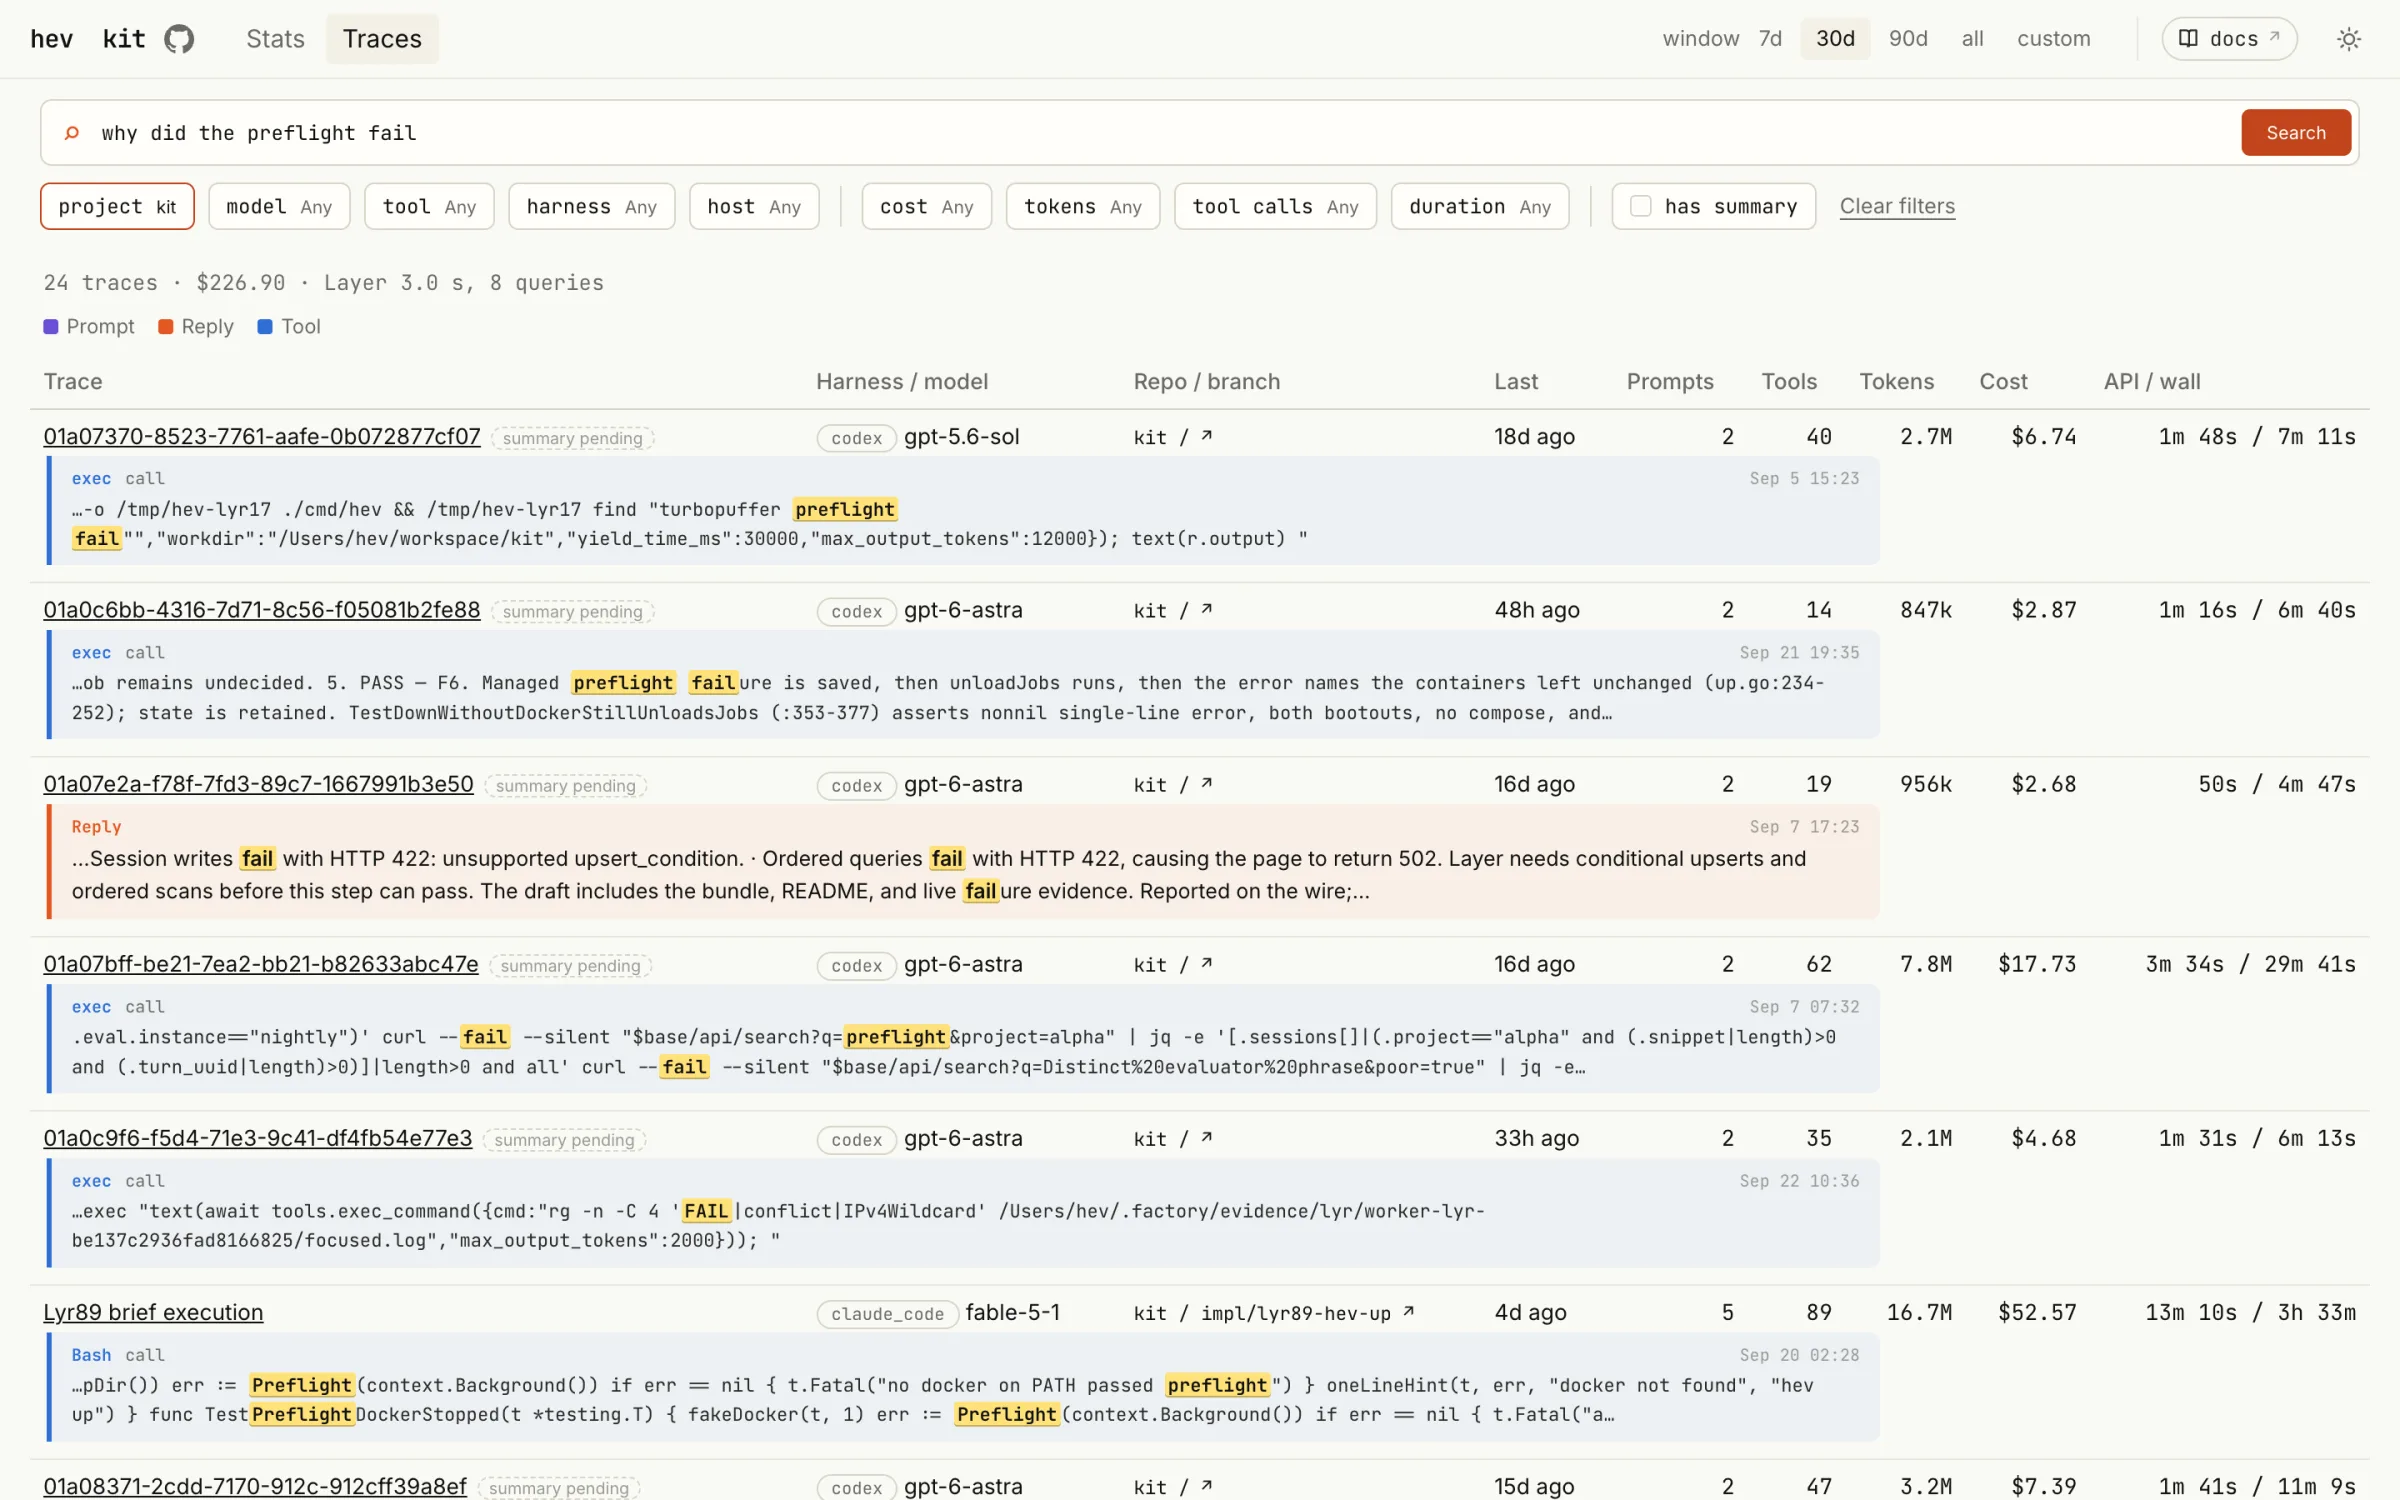
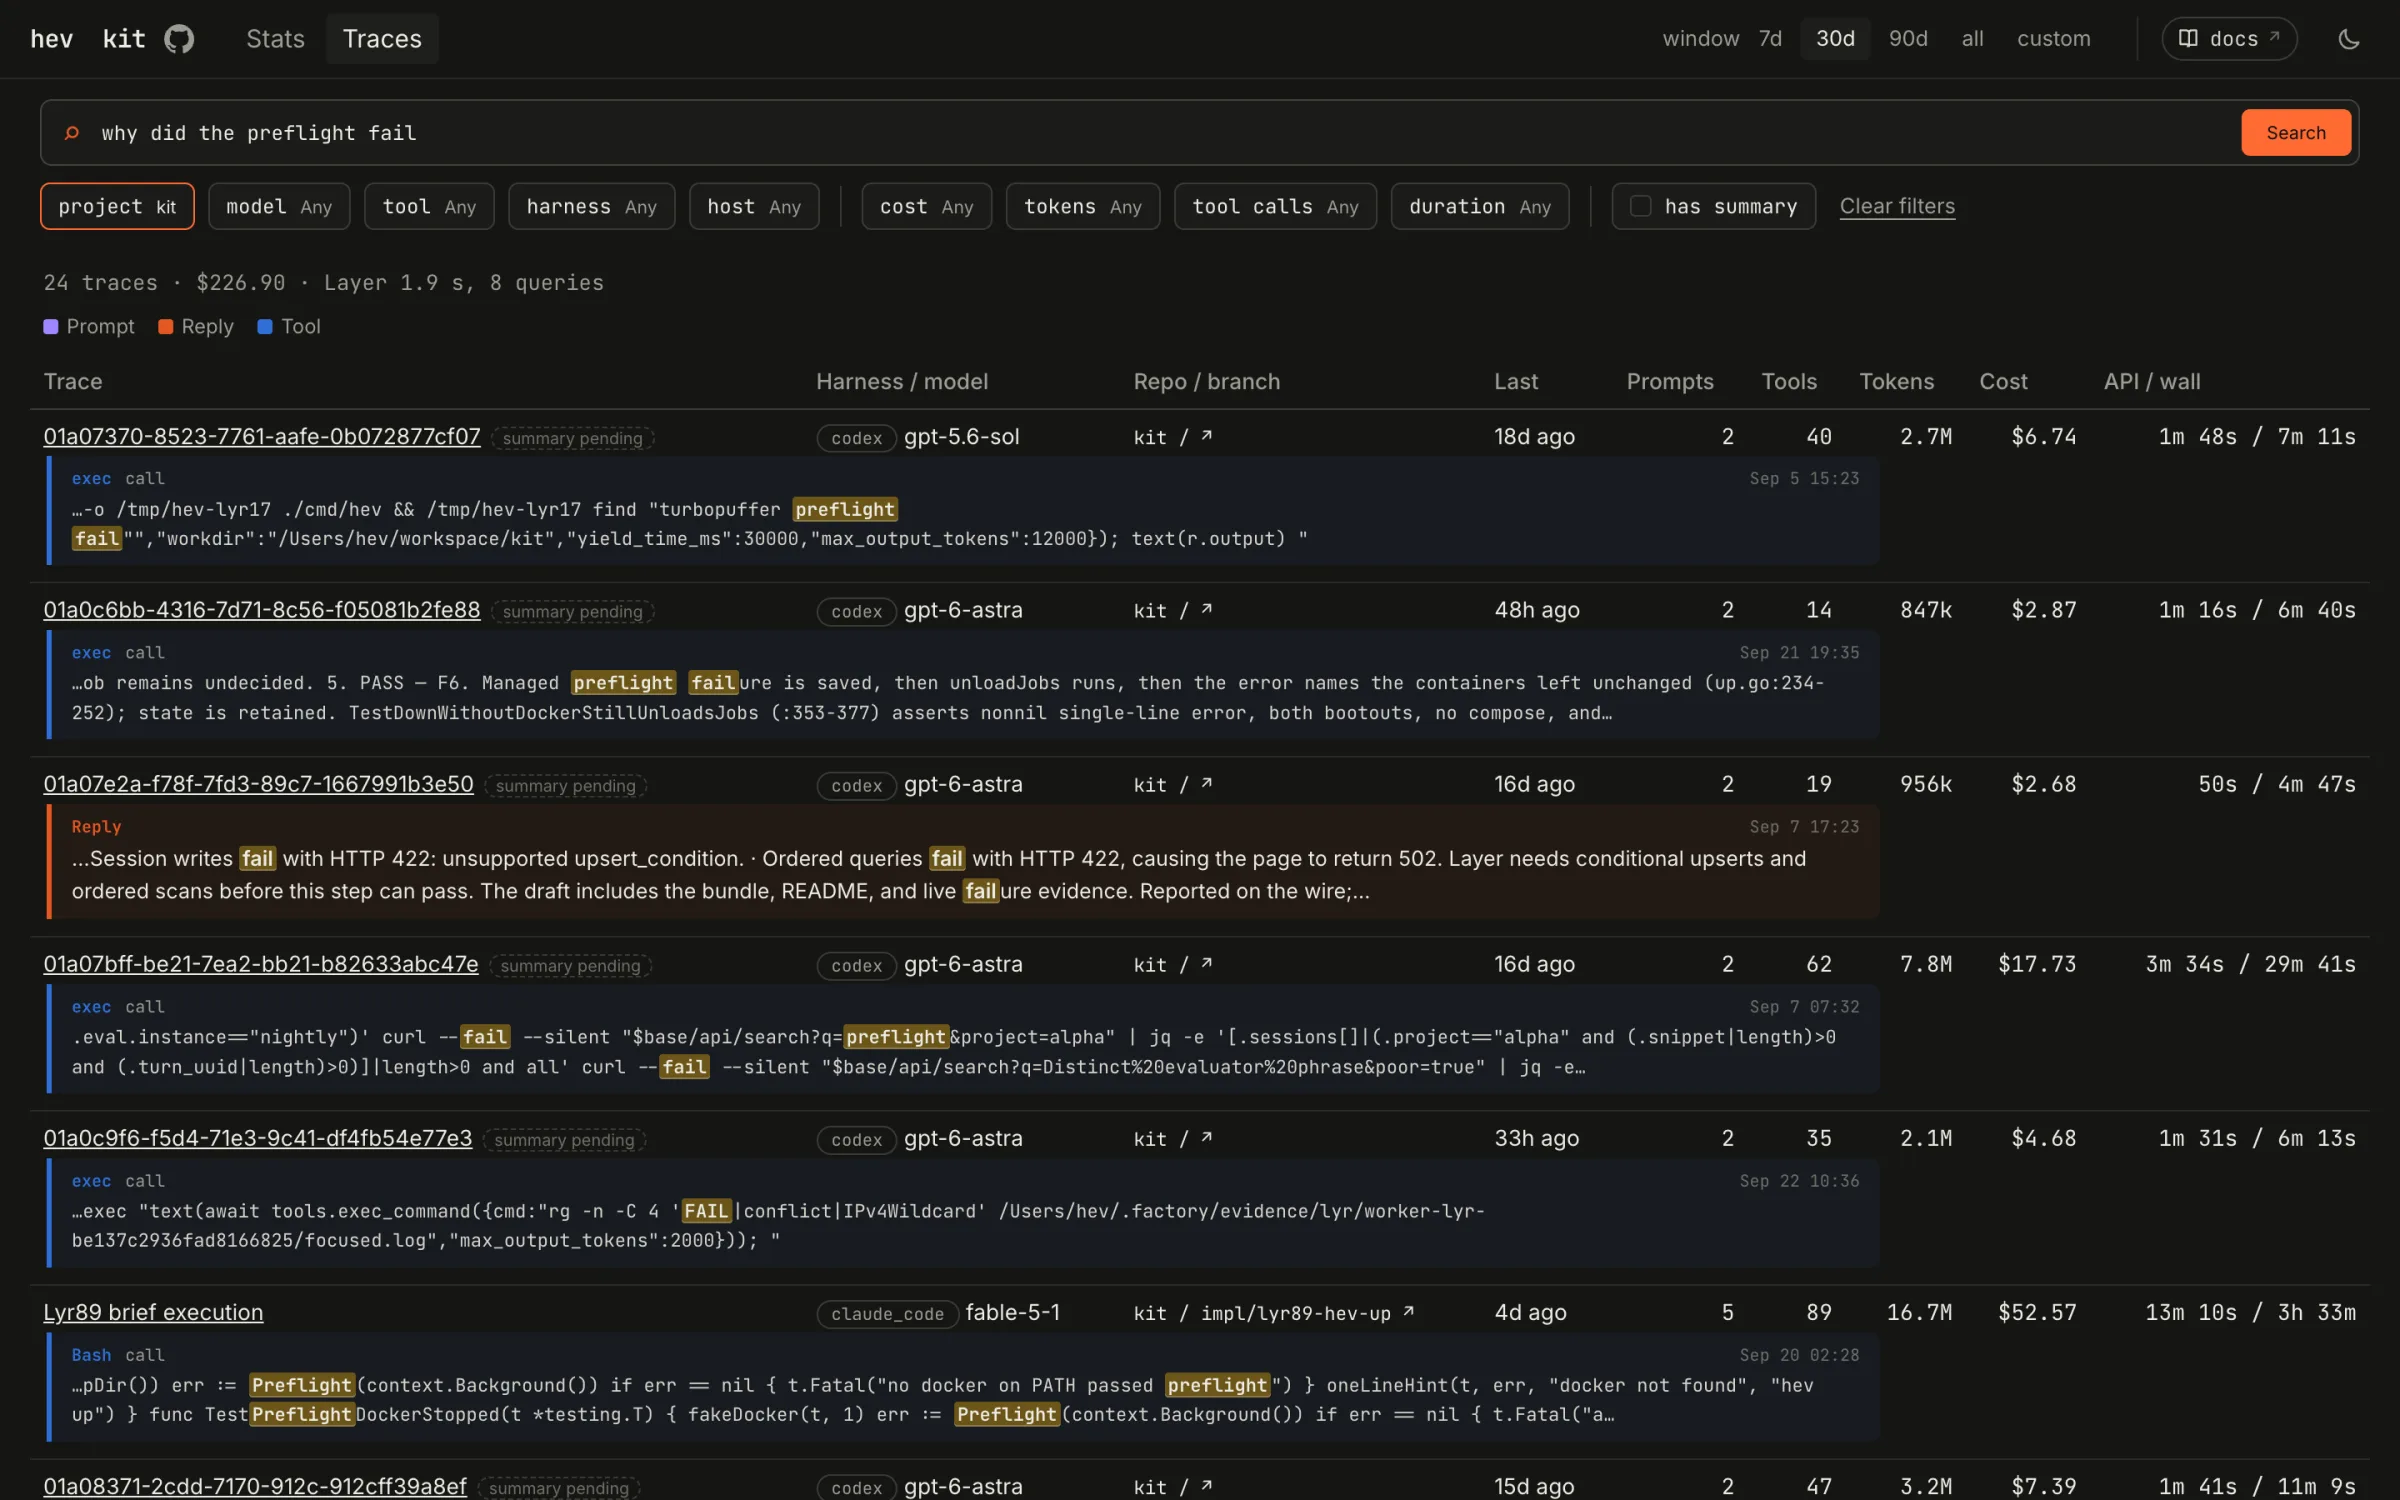
The same hybrid search as the CLI, with filters for harness, host, project, model and tool. Each hit shows where the words turned up, down to the command the agent ran.
Transcript
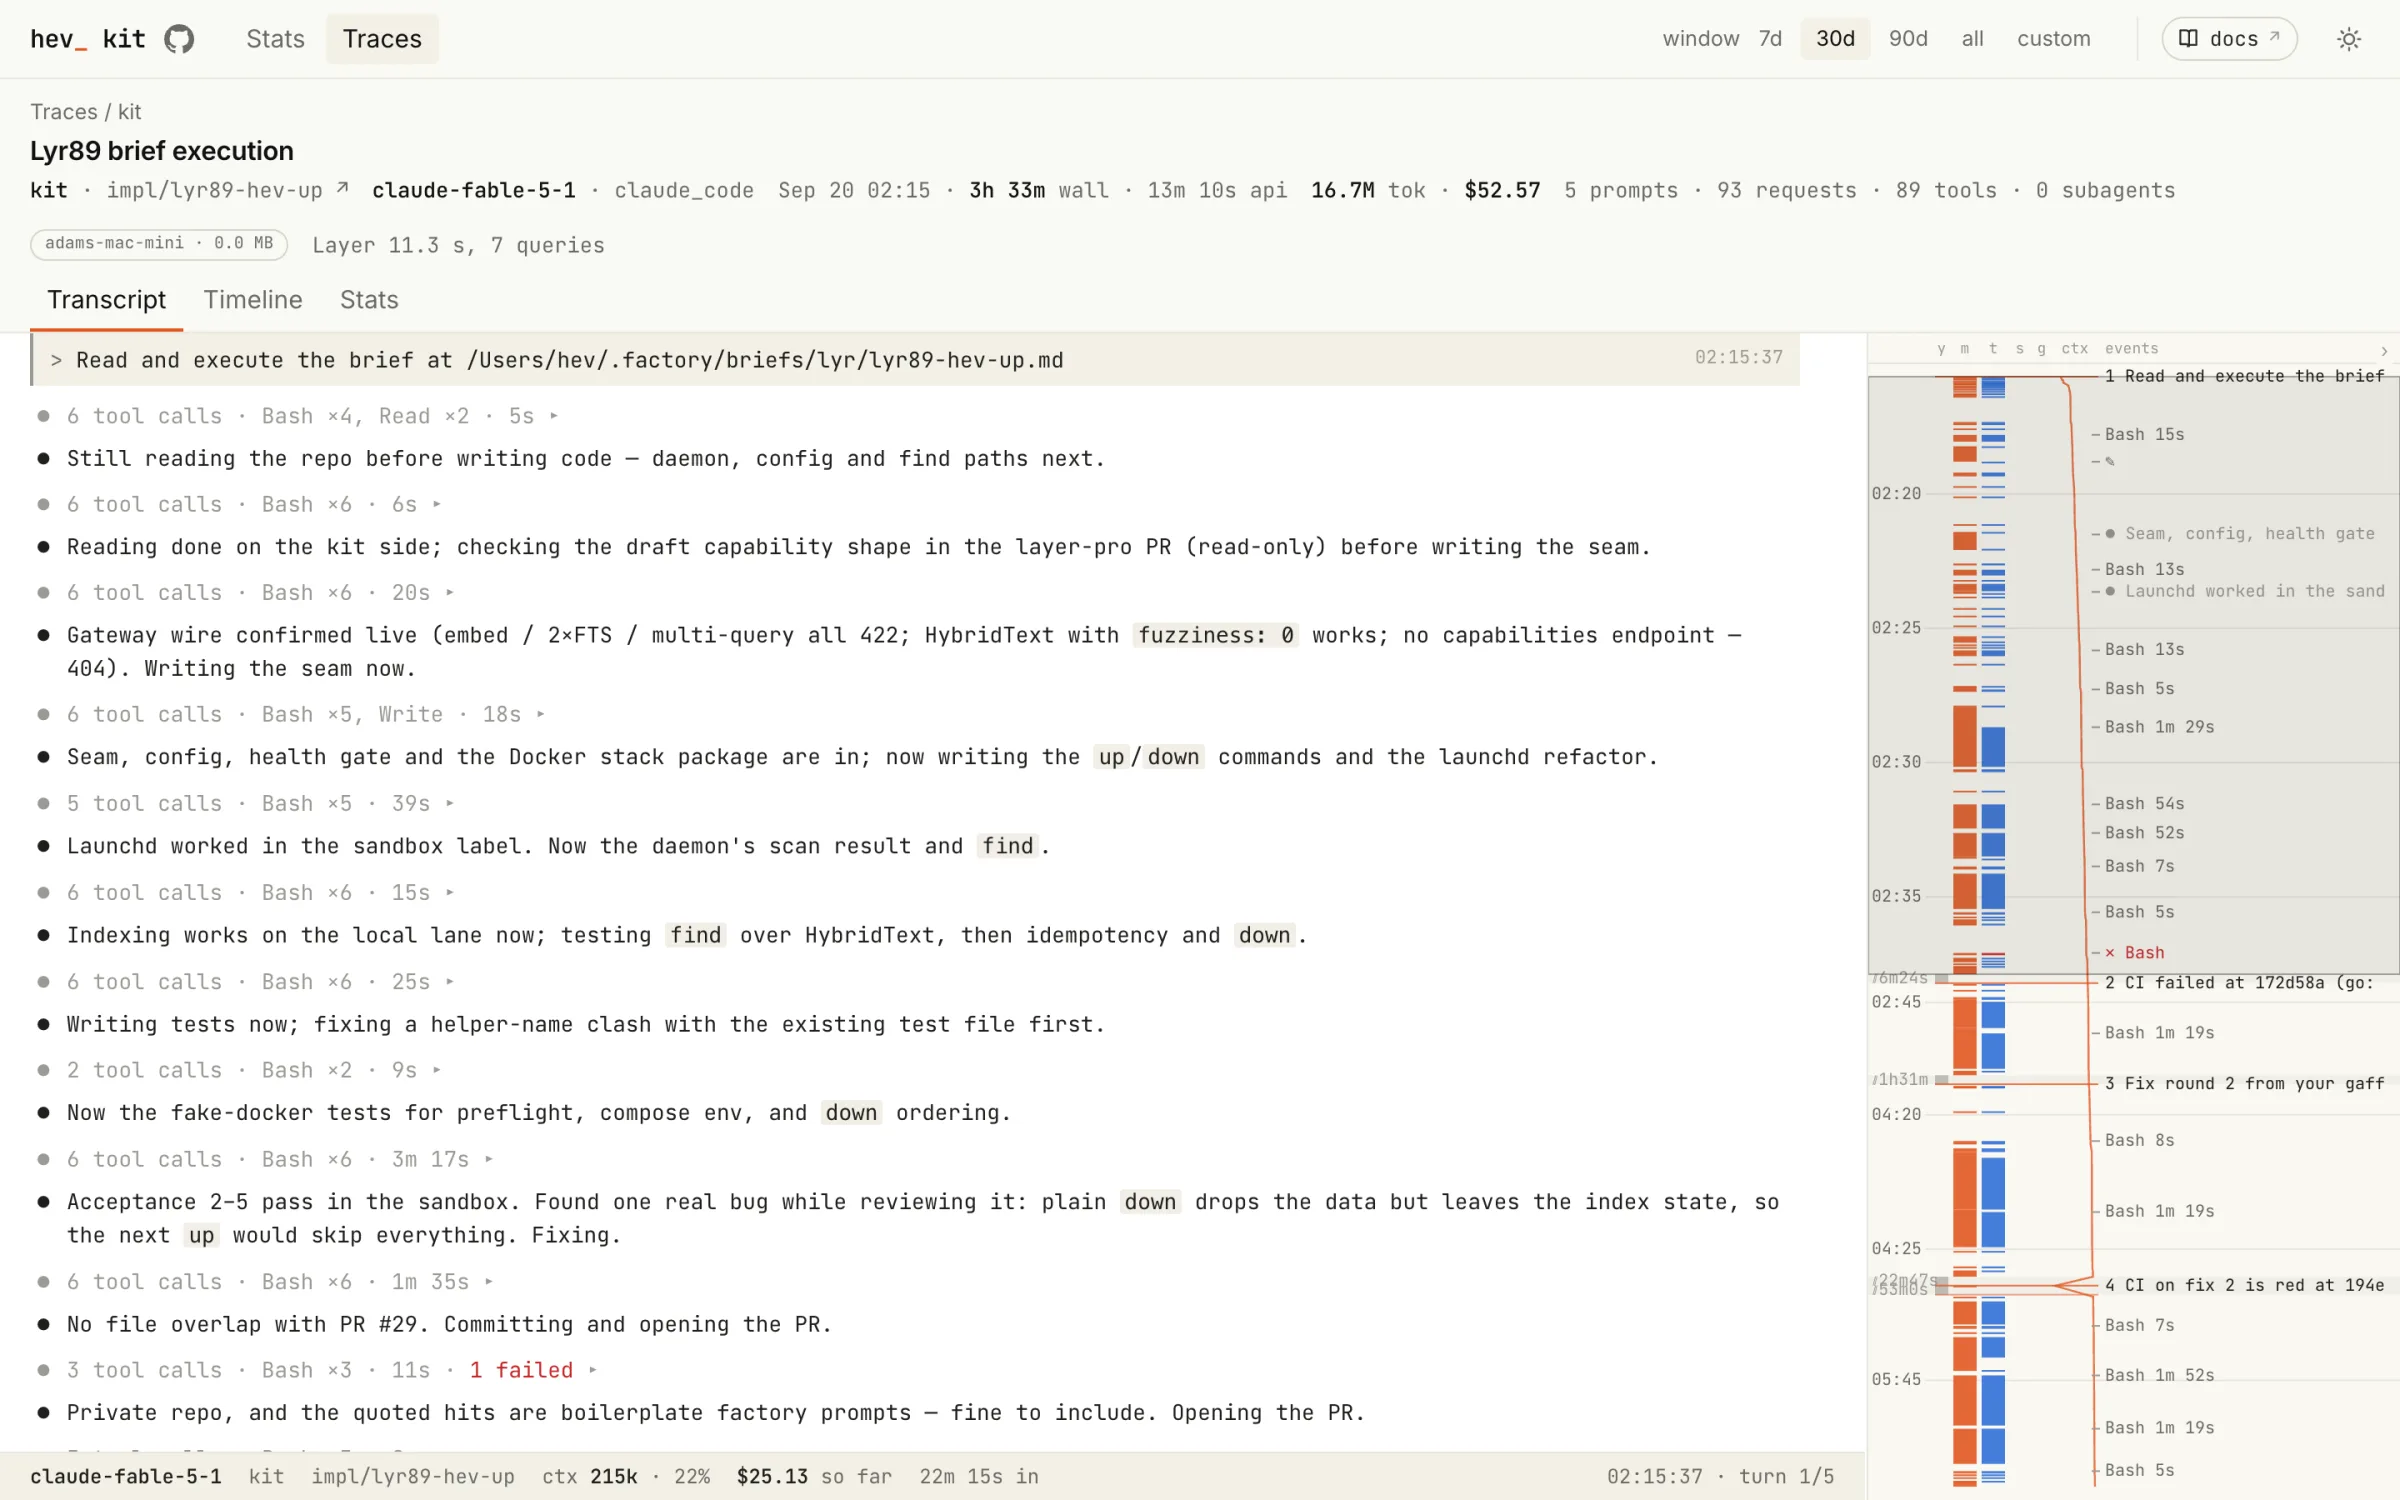
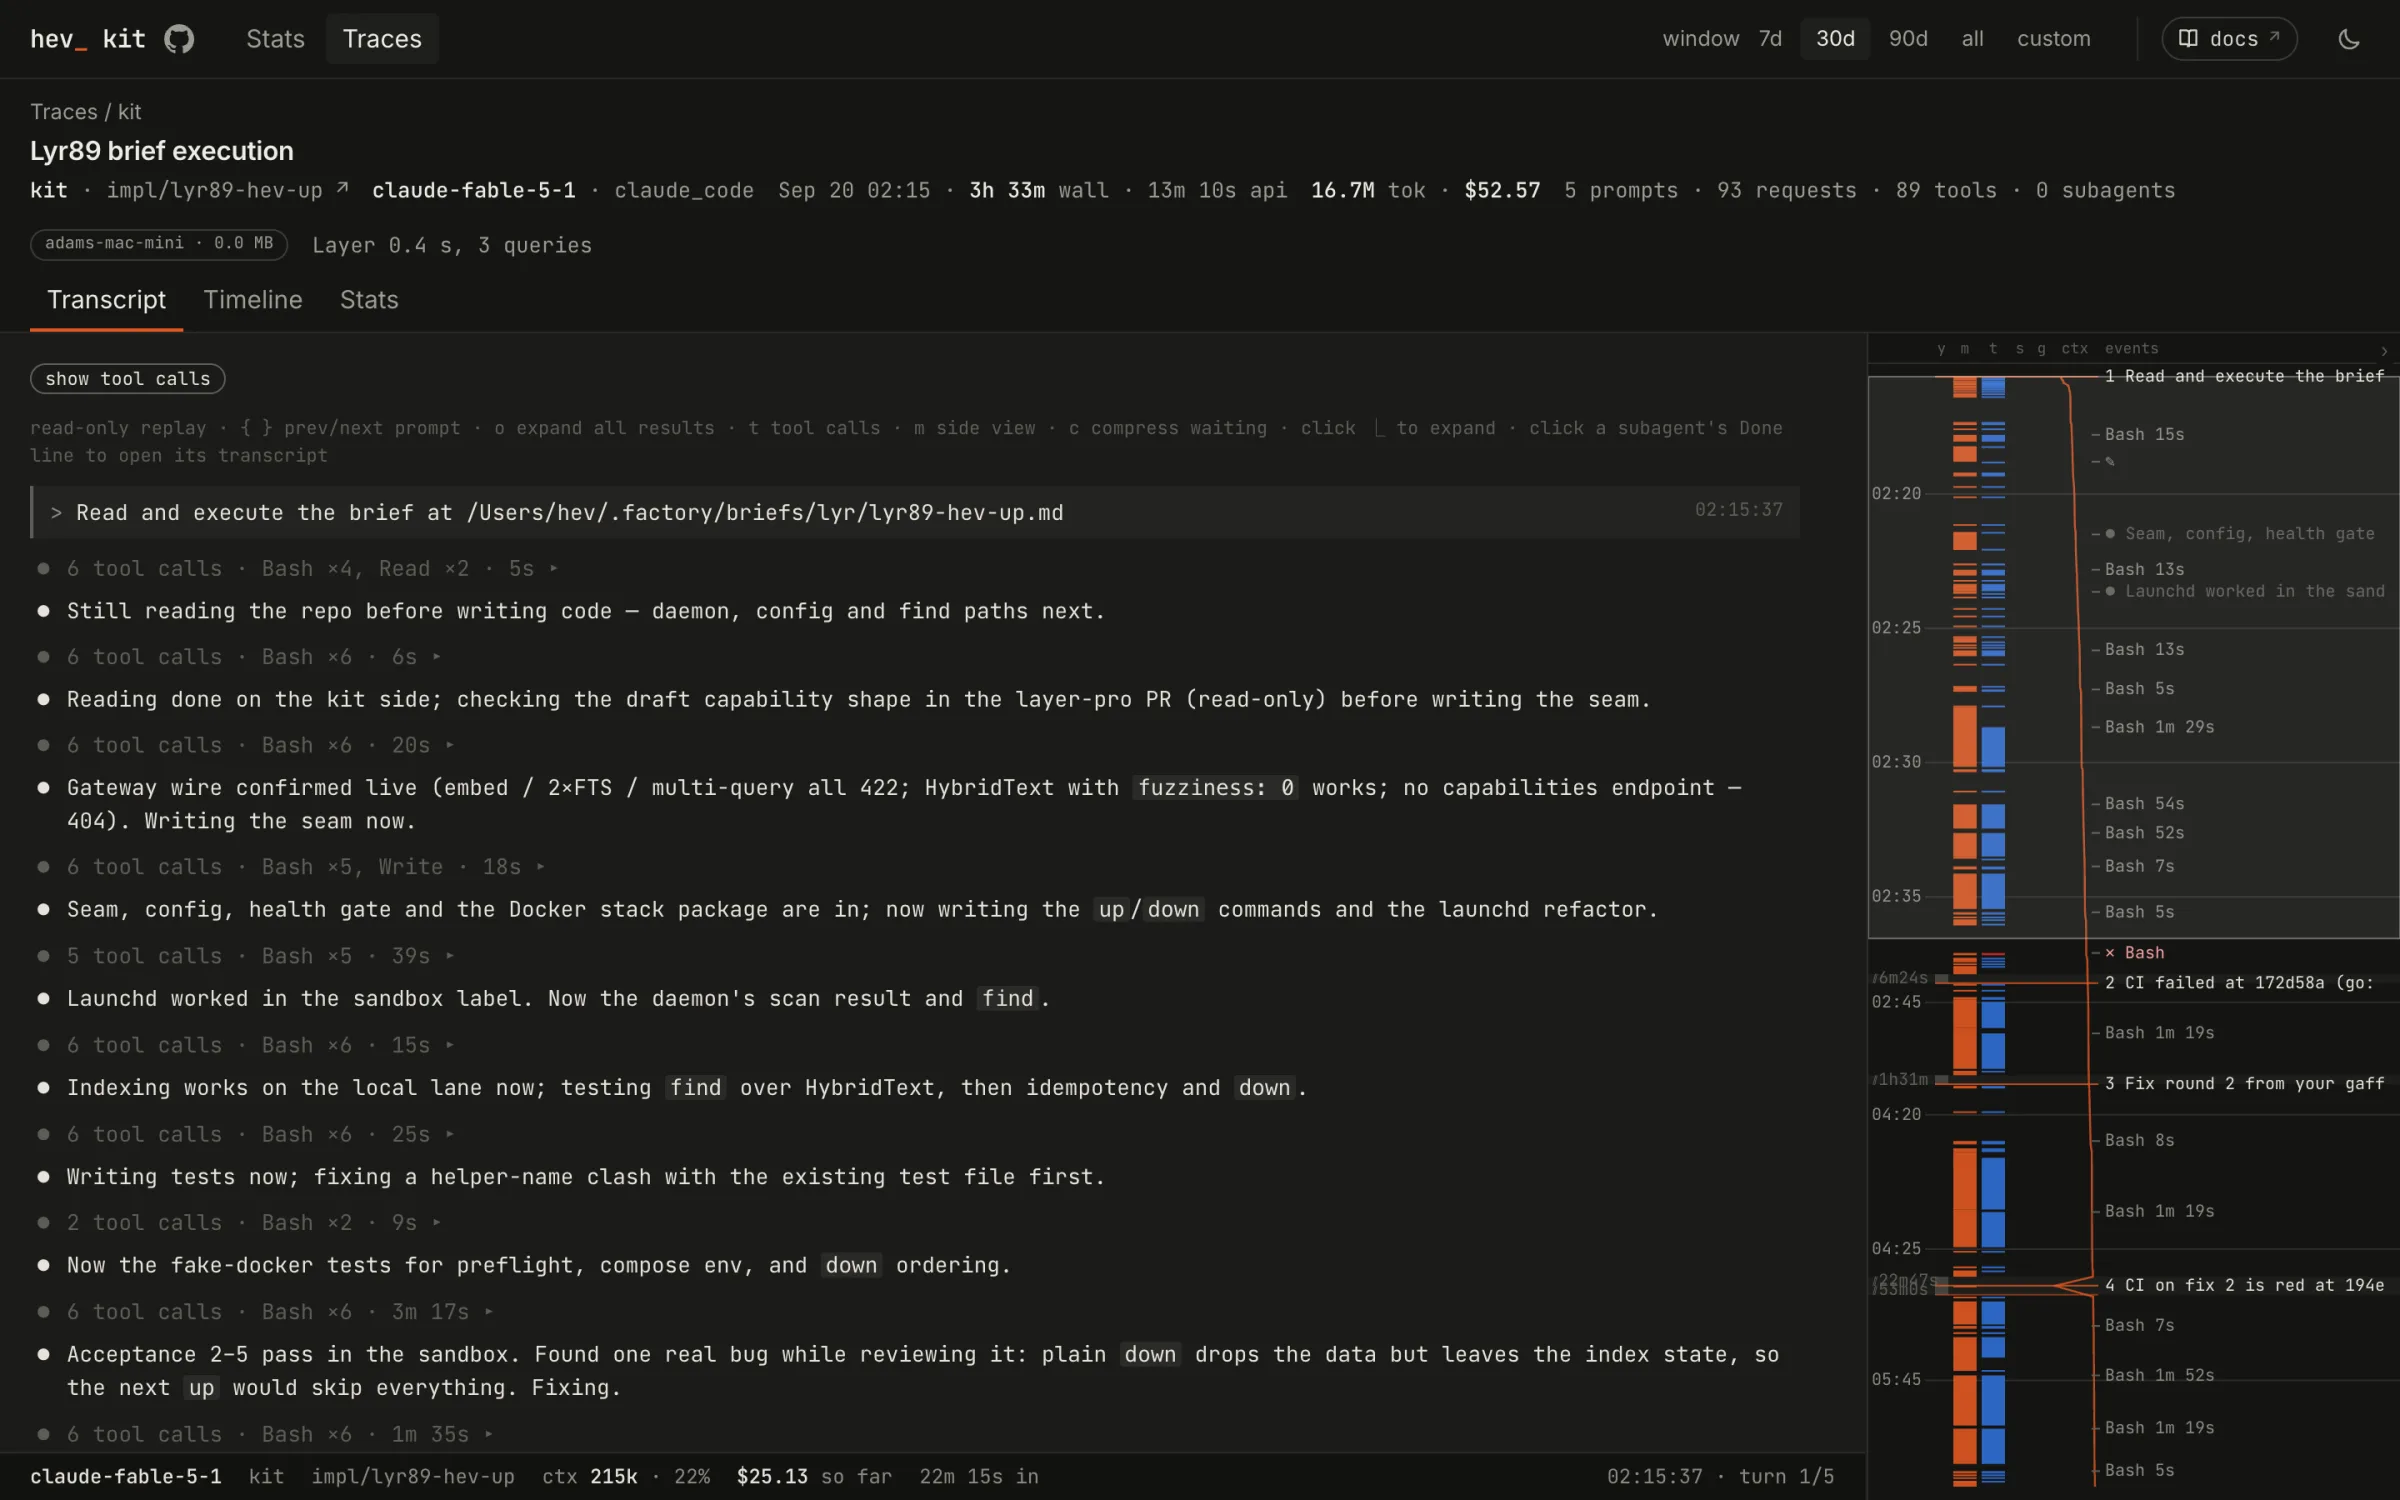
A trace replays in the harness’s own shape: your prompt, the agent’s narration, and tool calls folded until you open them. The rail on the right marks every prompt, failure and wait.
Timeline
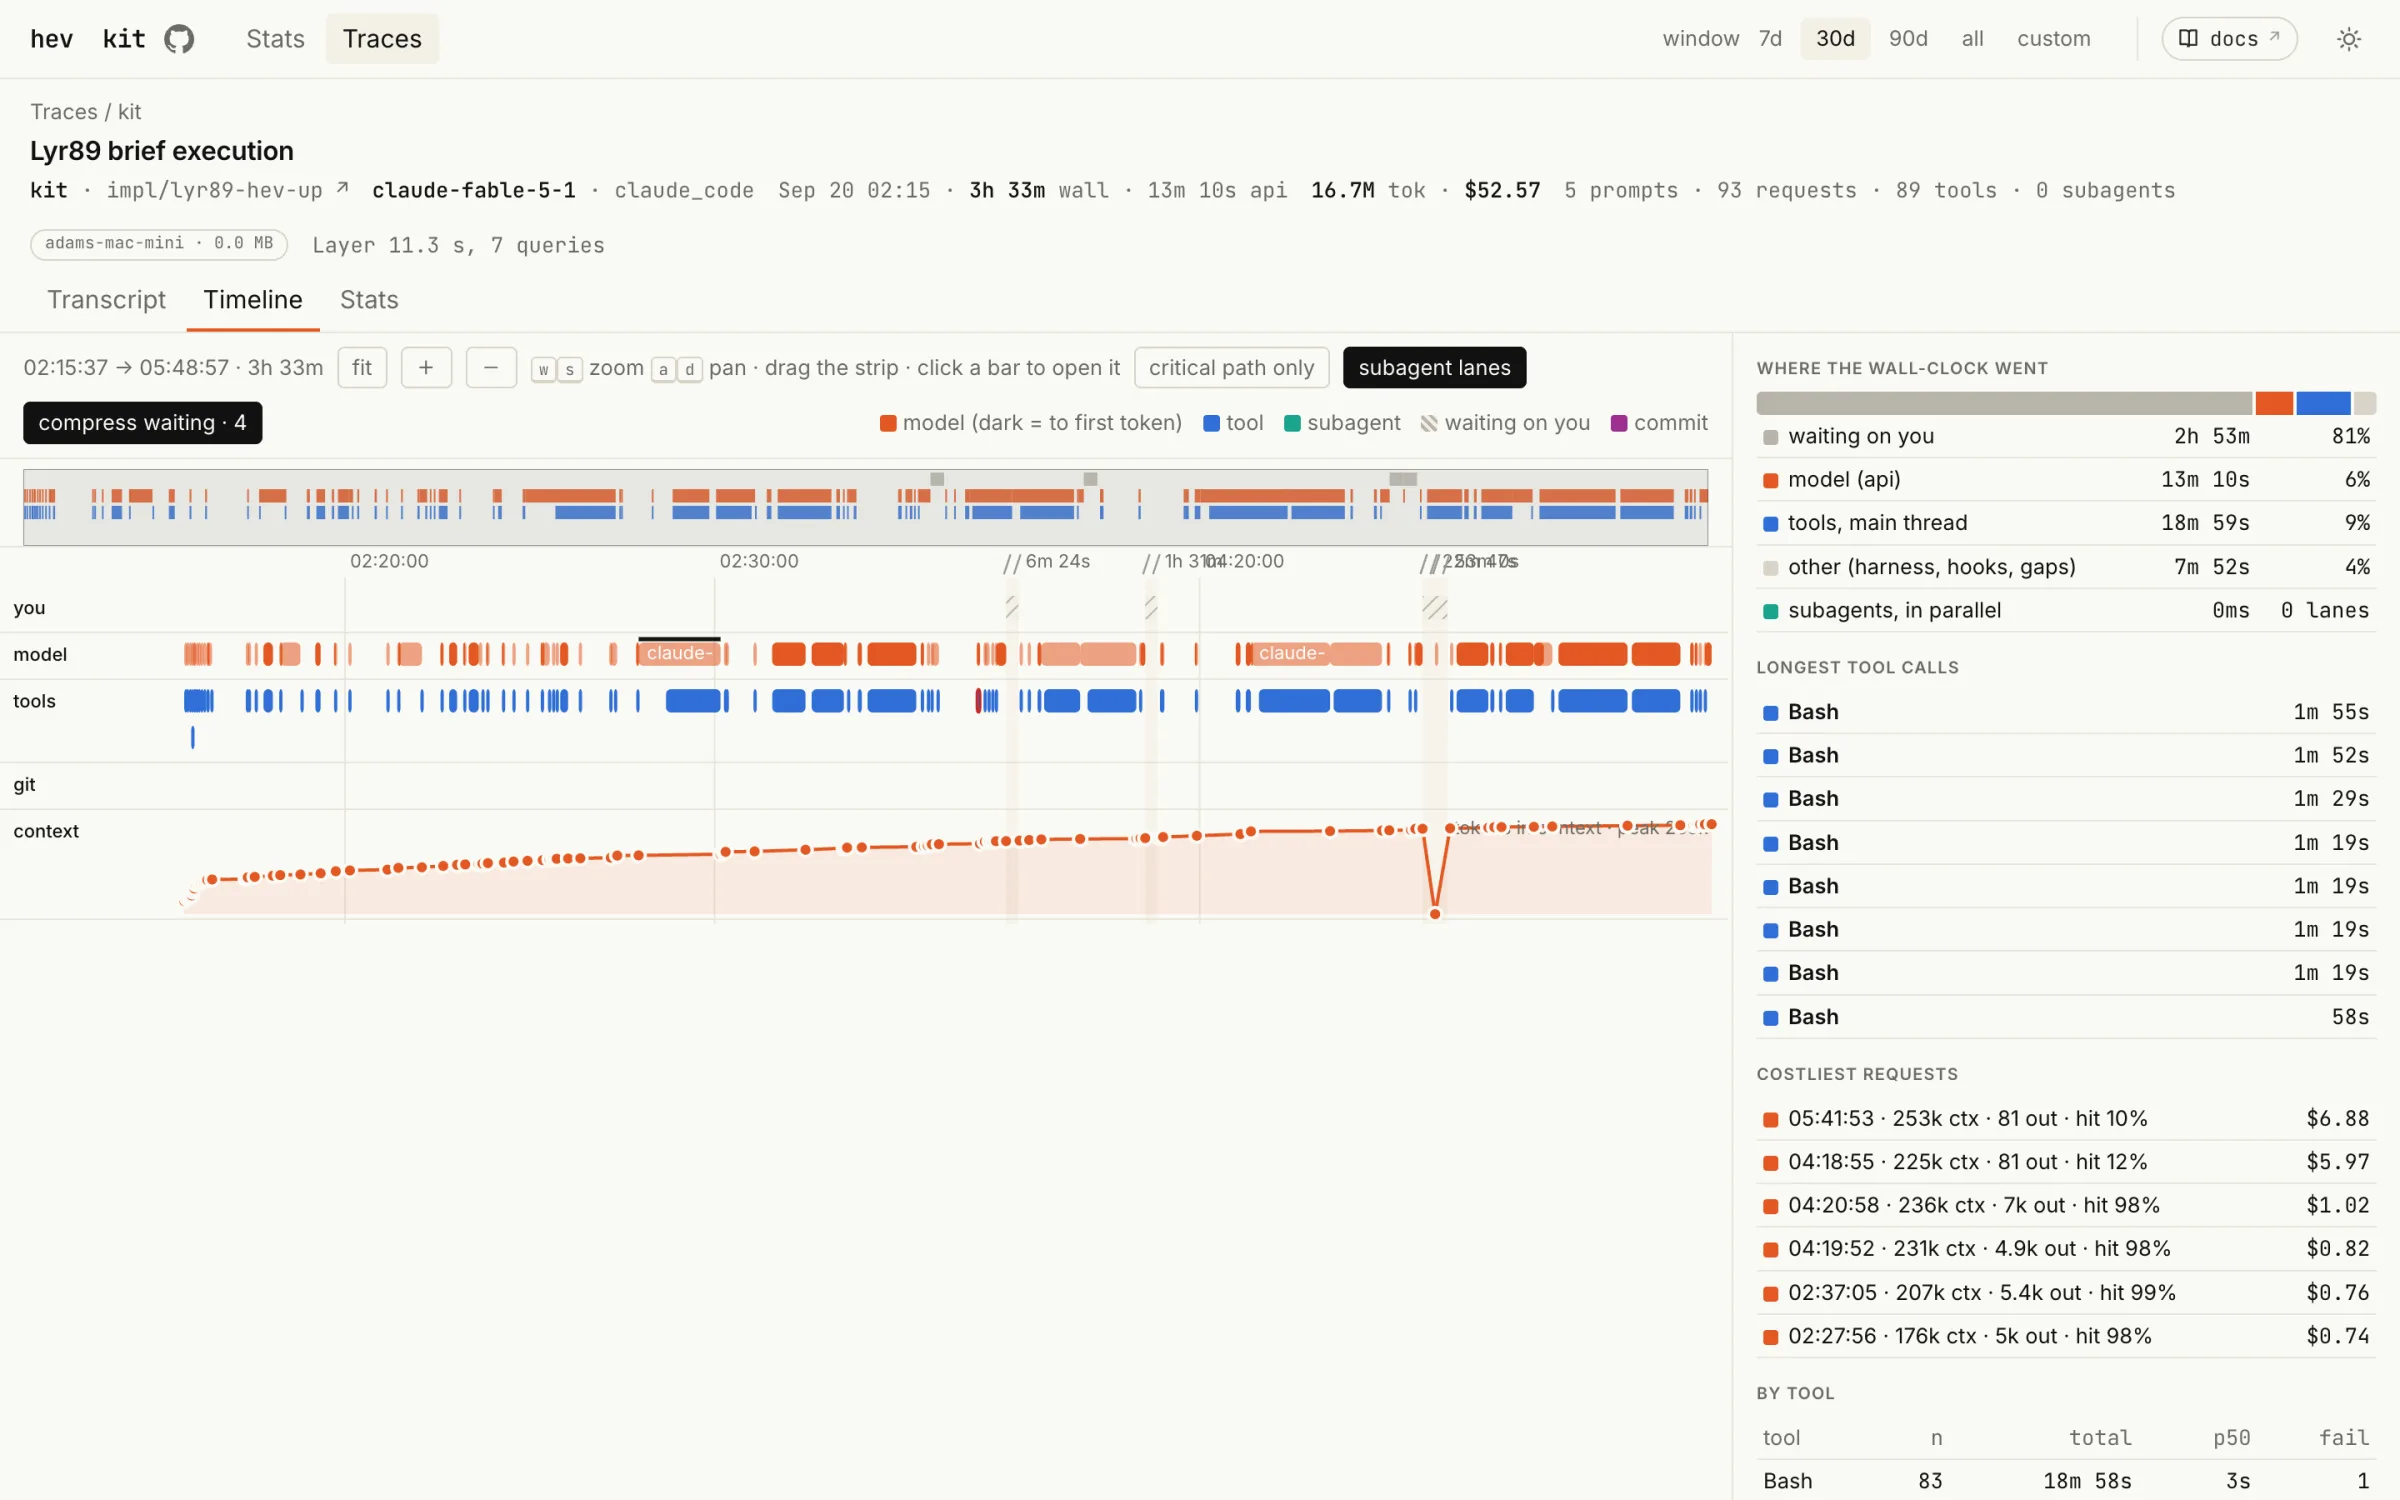
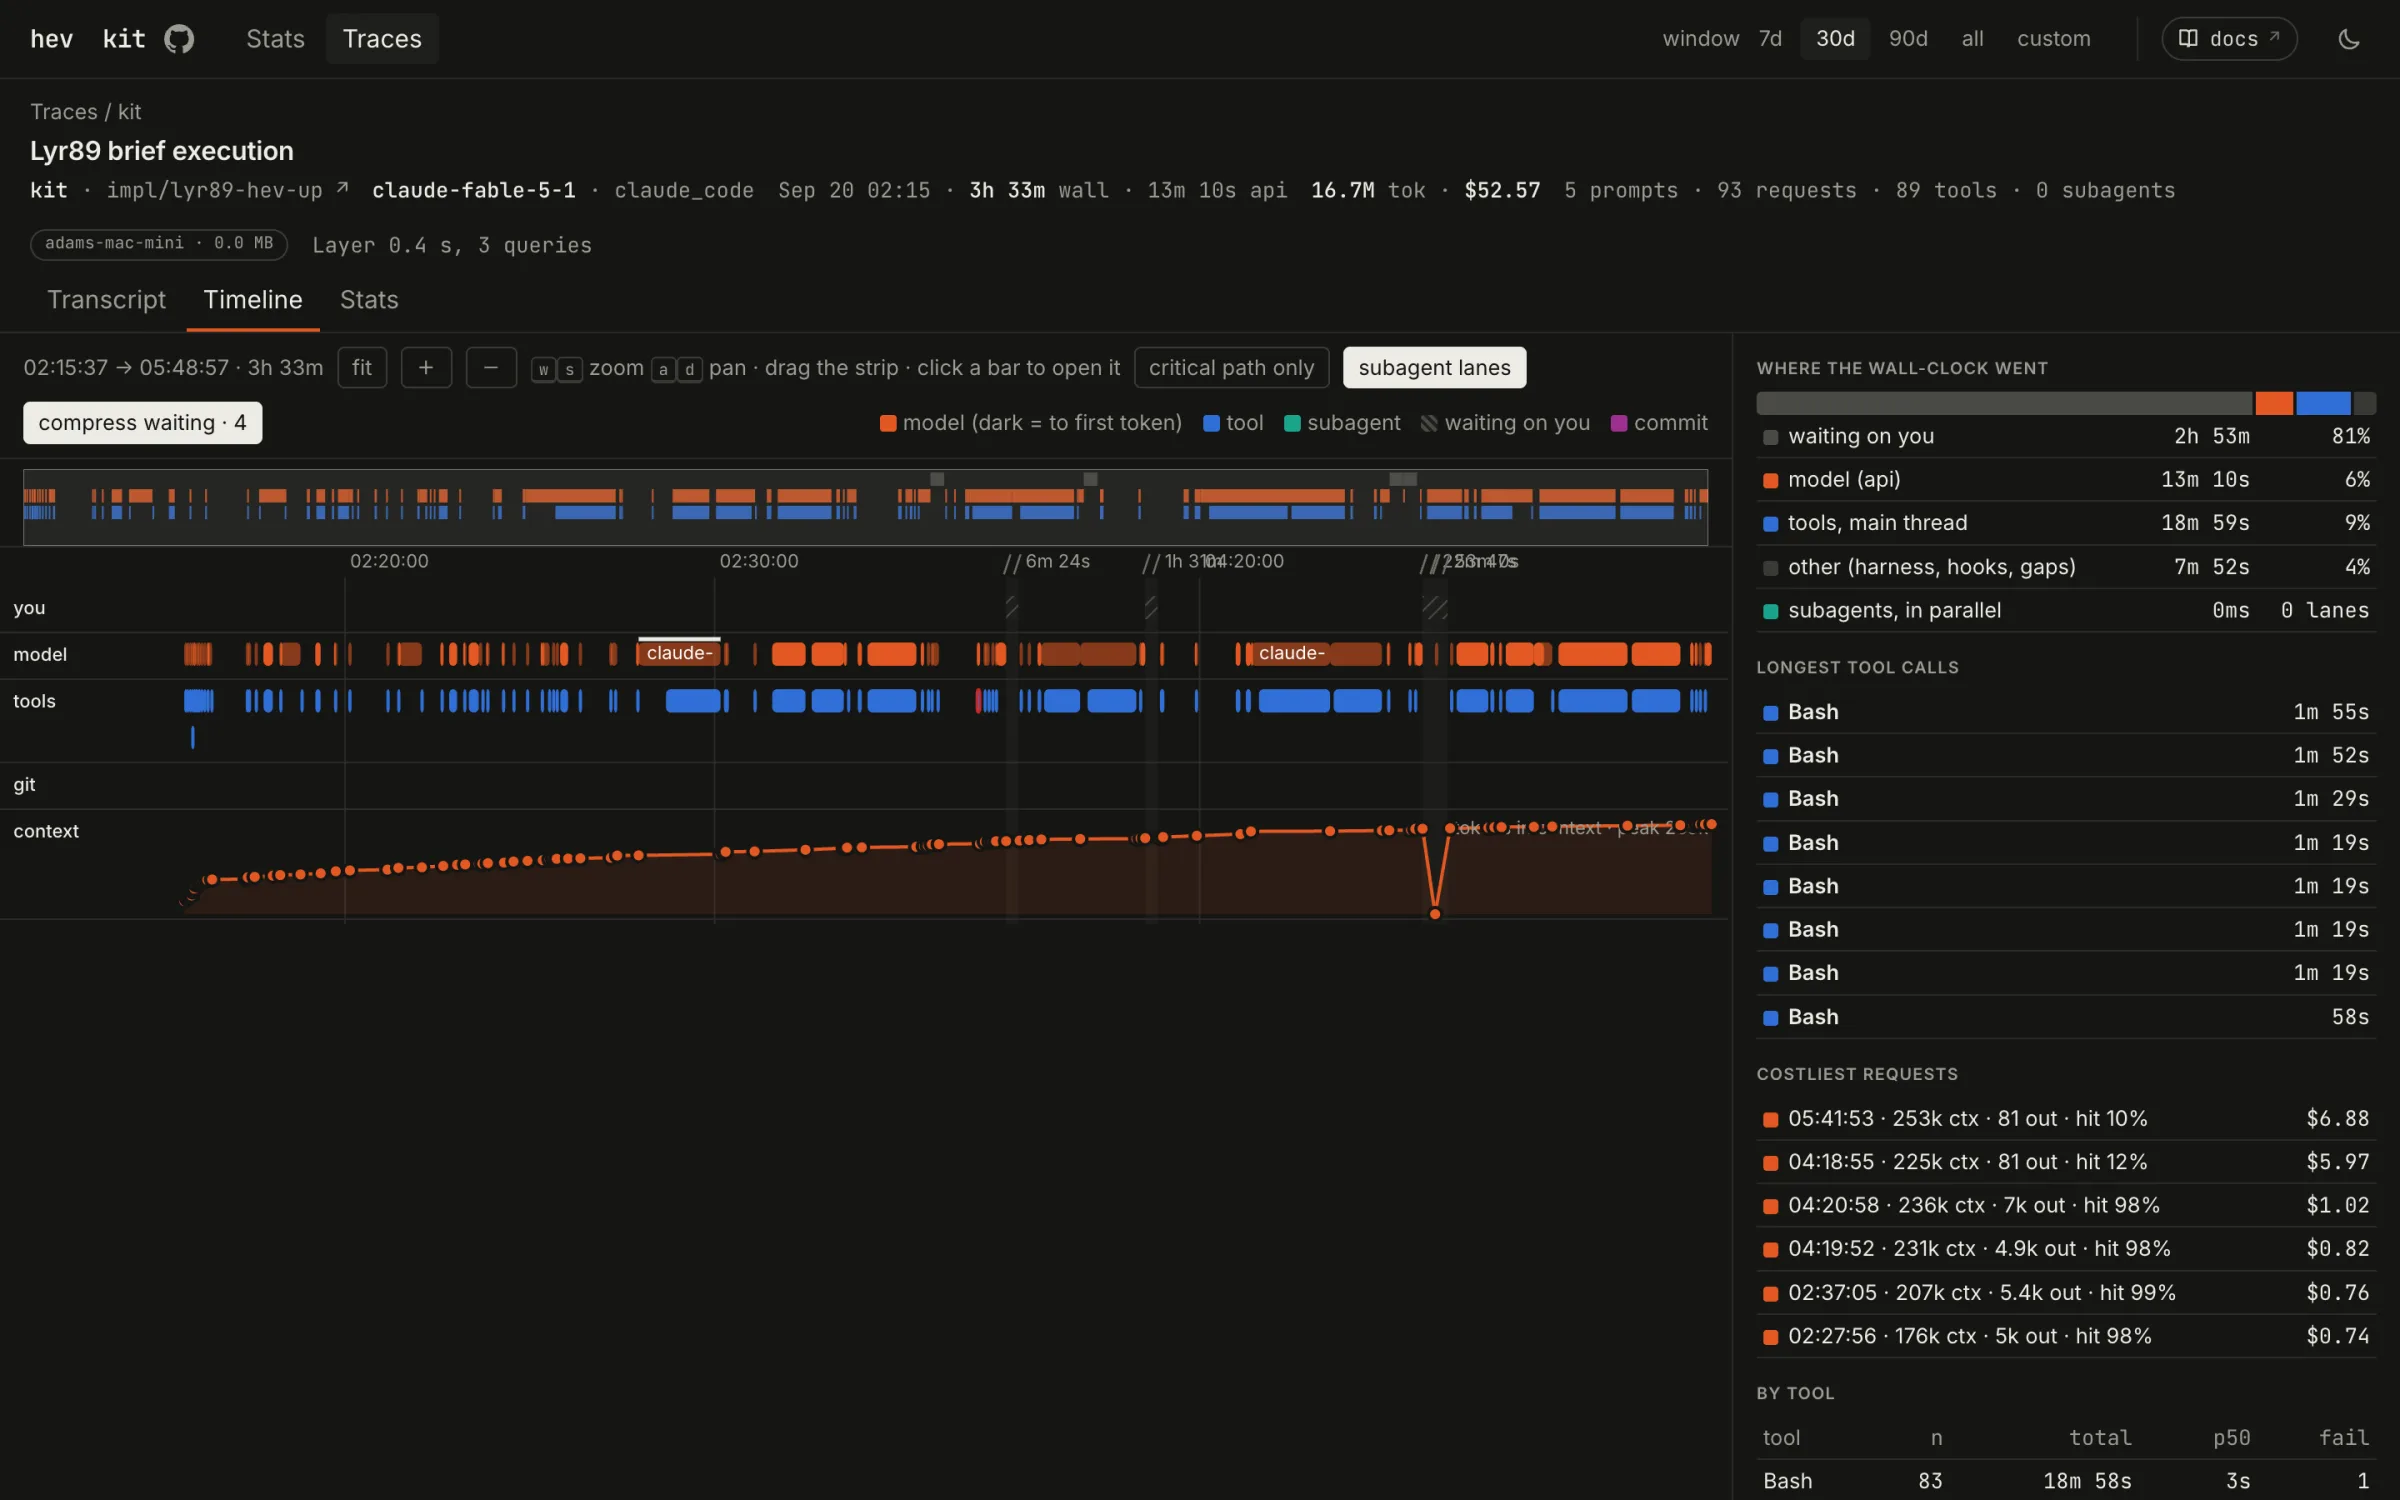
The timeline splits wall-clock time into you, the model and its tools, with context size underneath. It shows where a session went: often most of it is the agent waiting on a person.
Cost
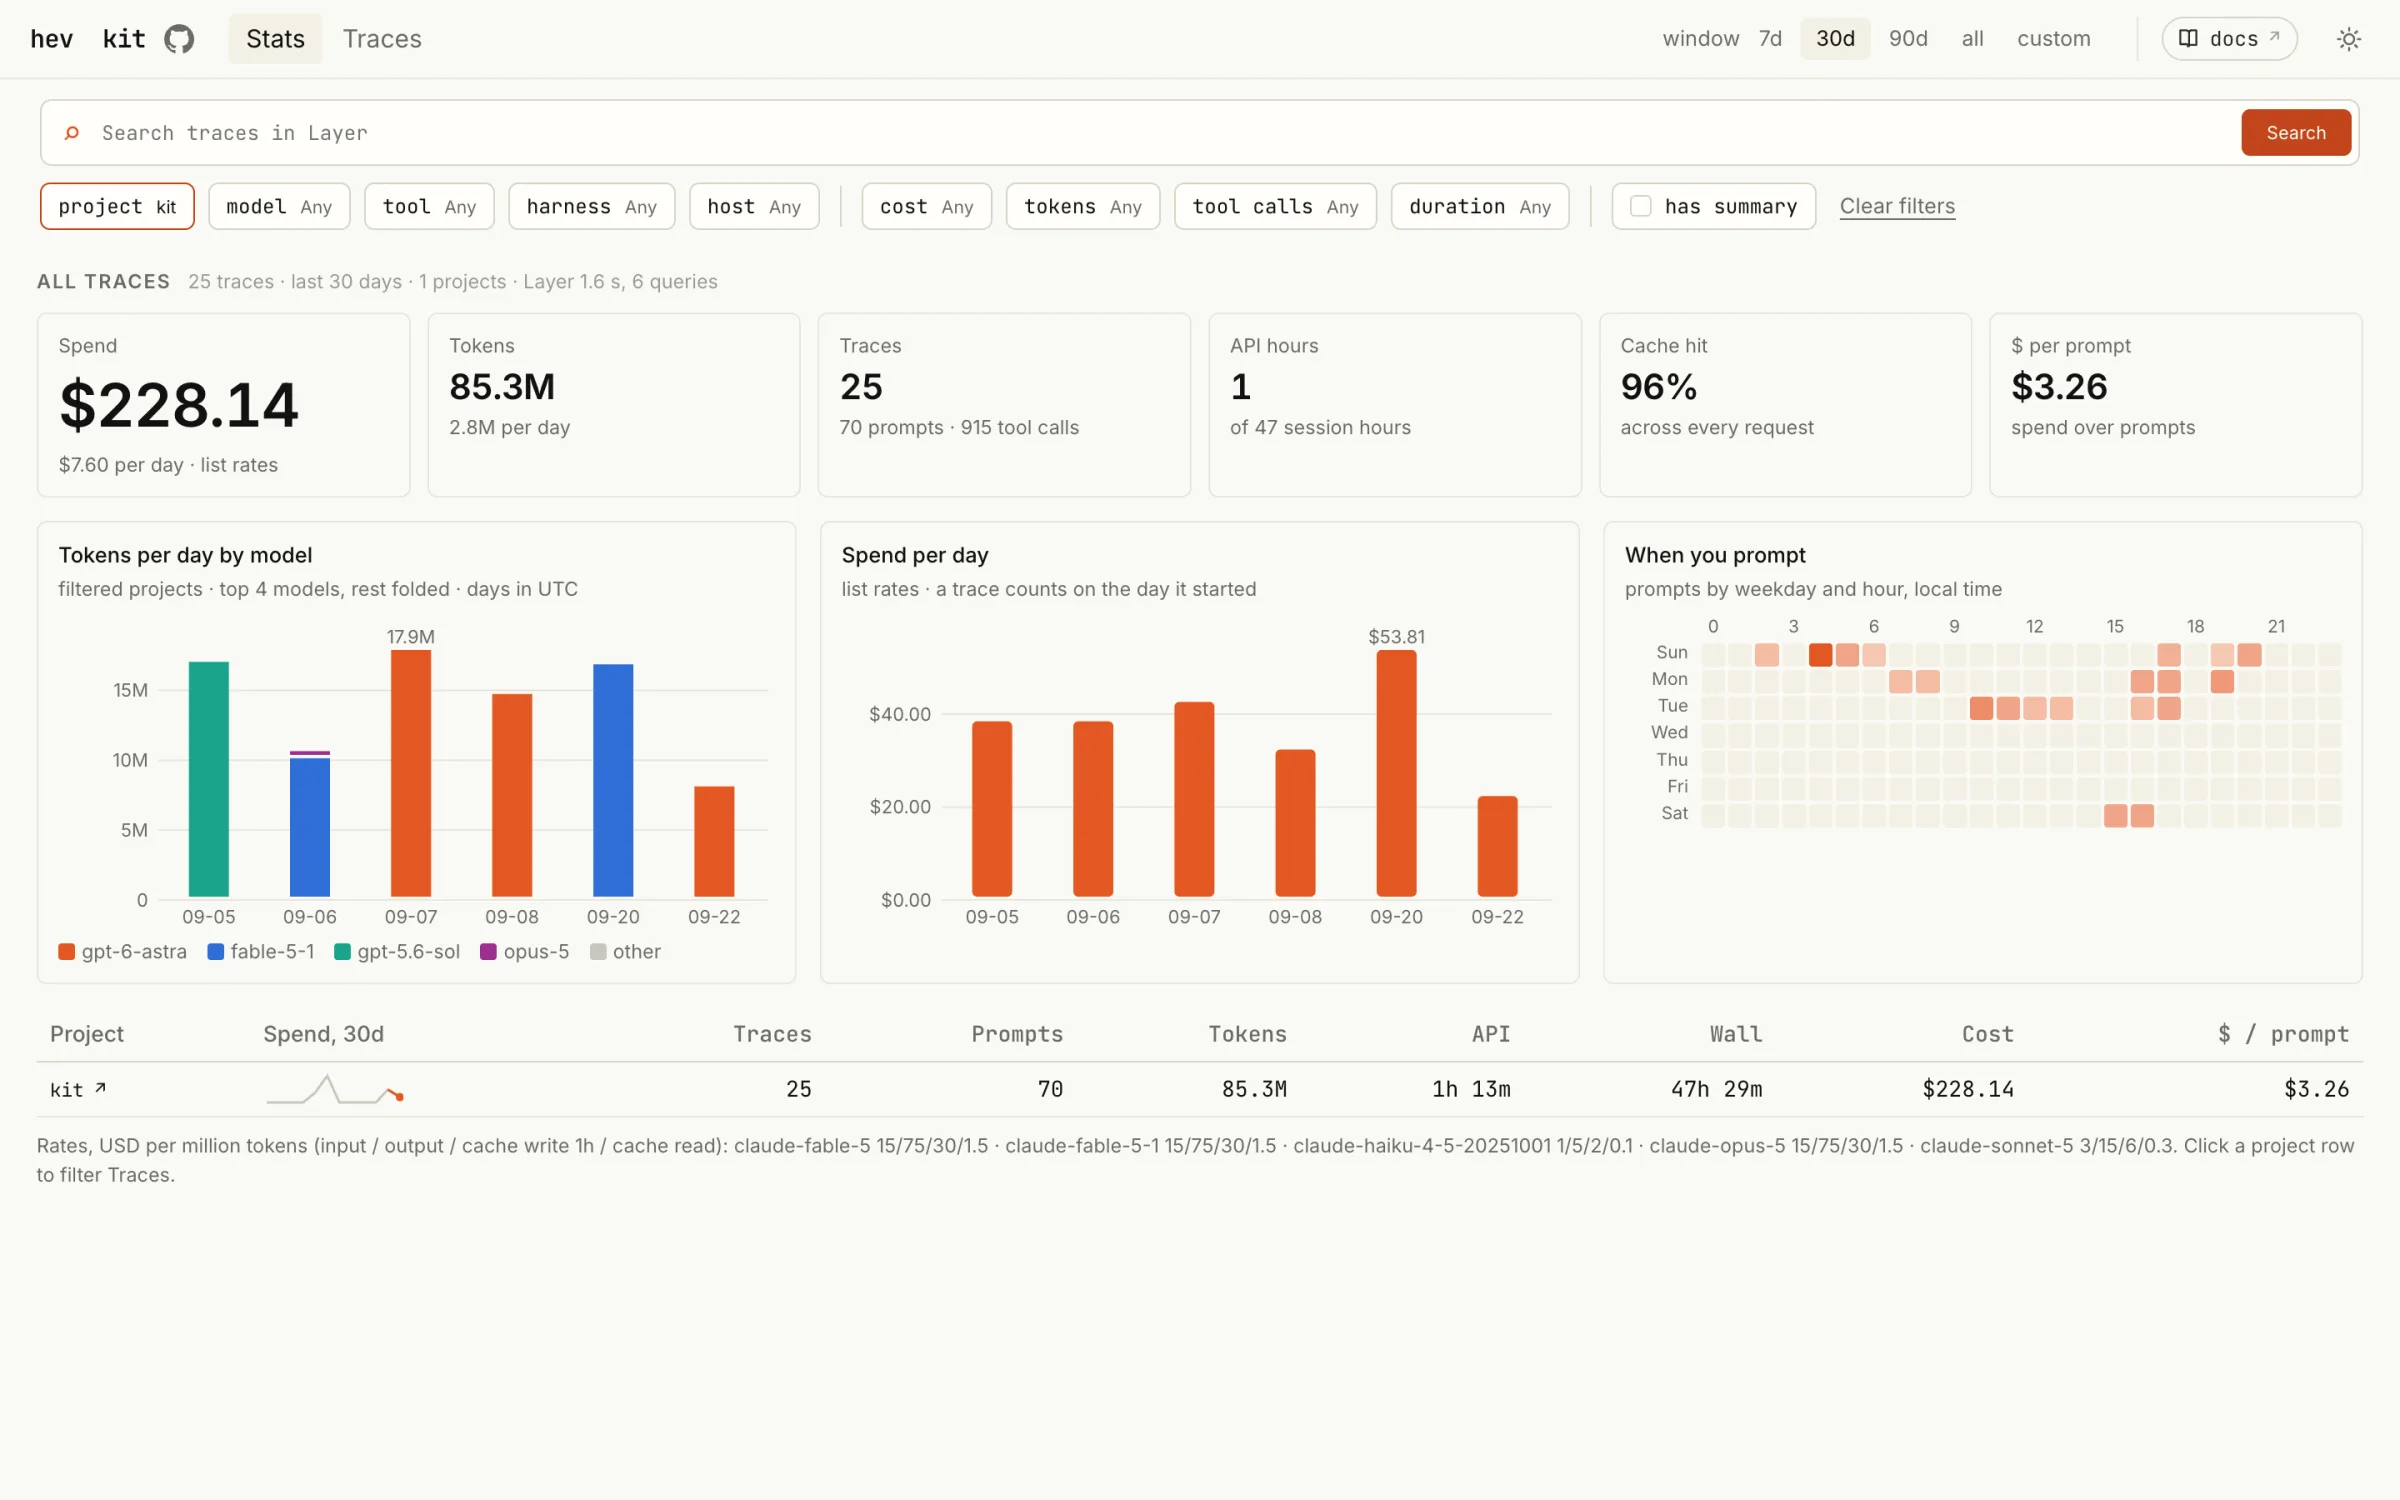
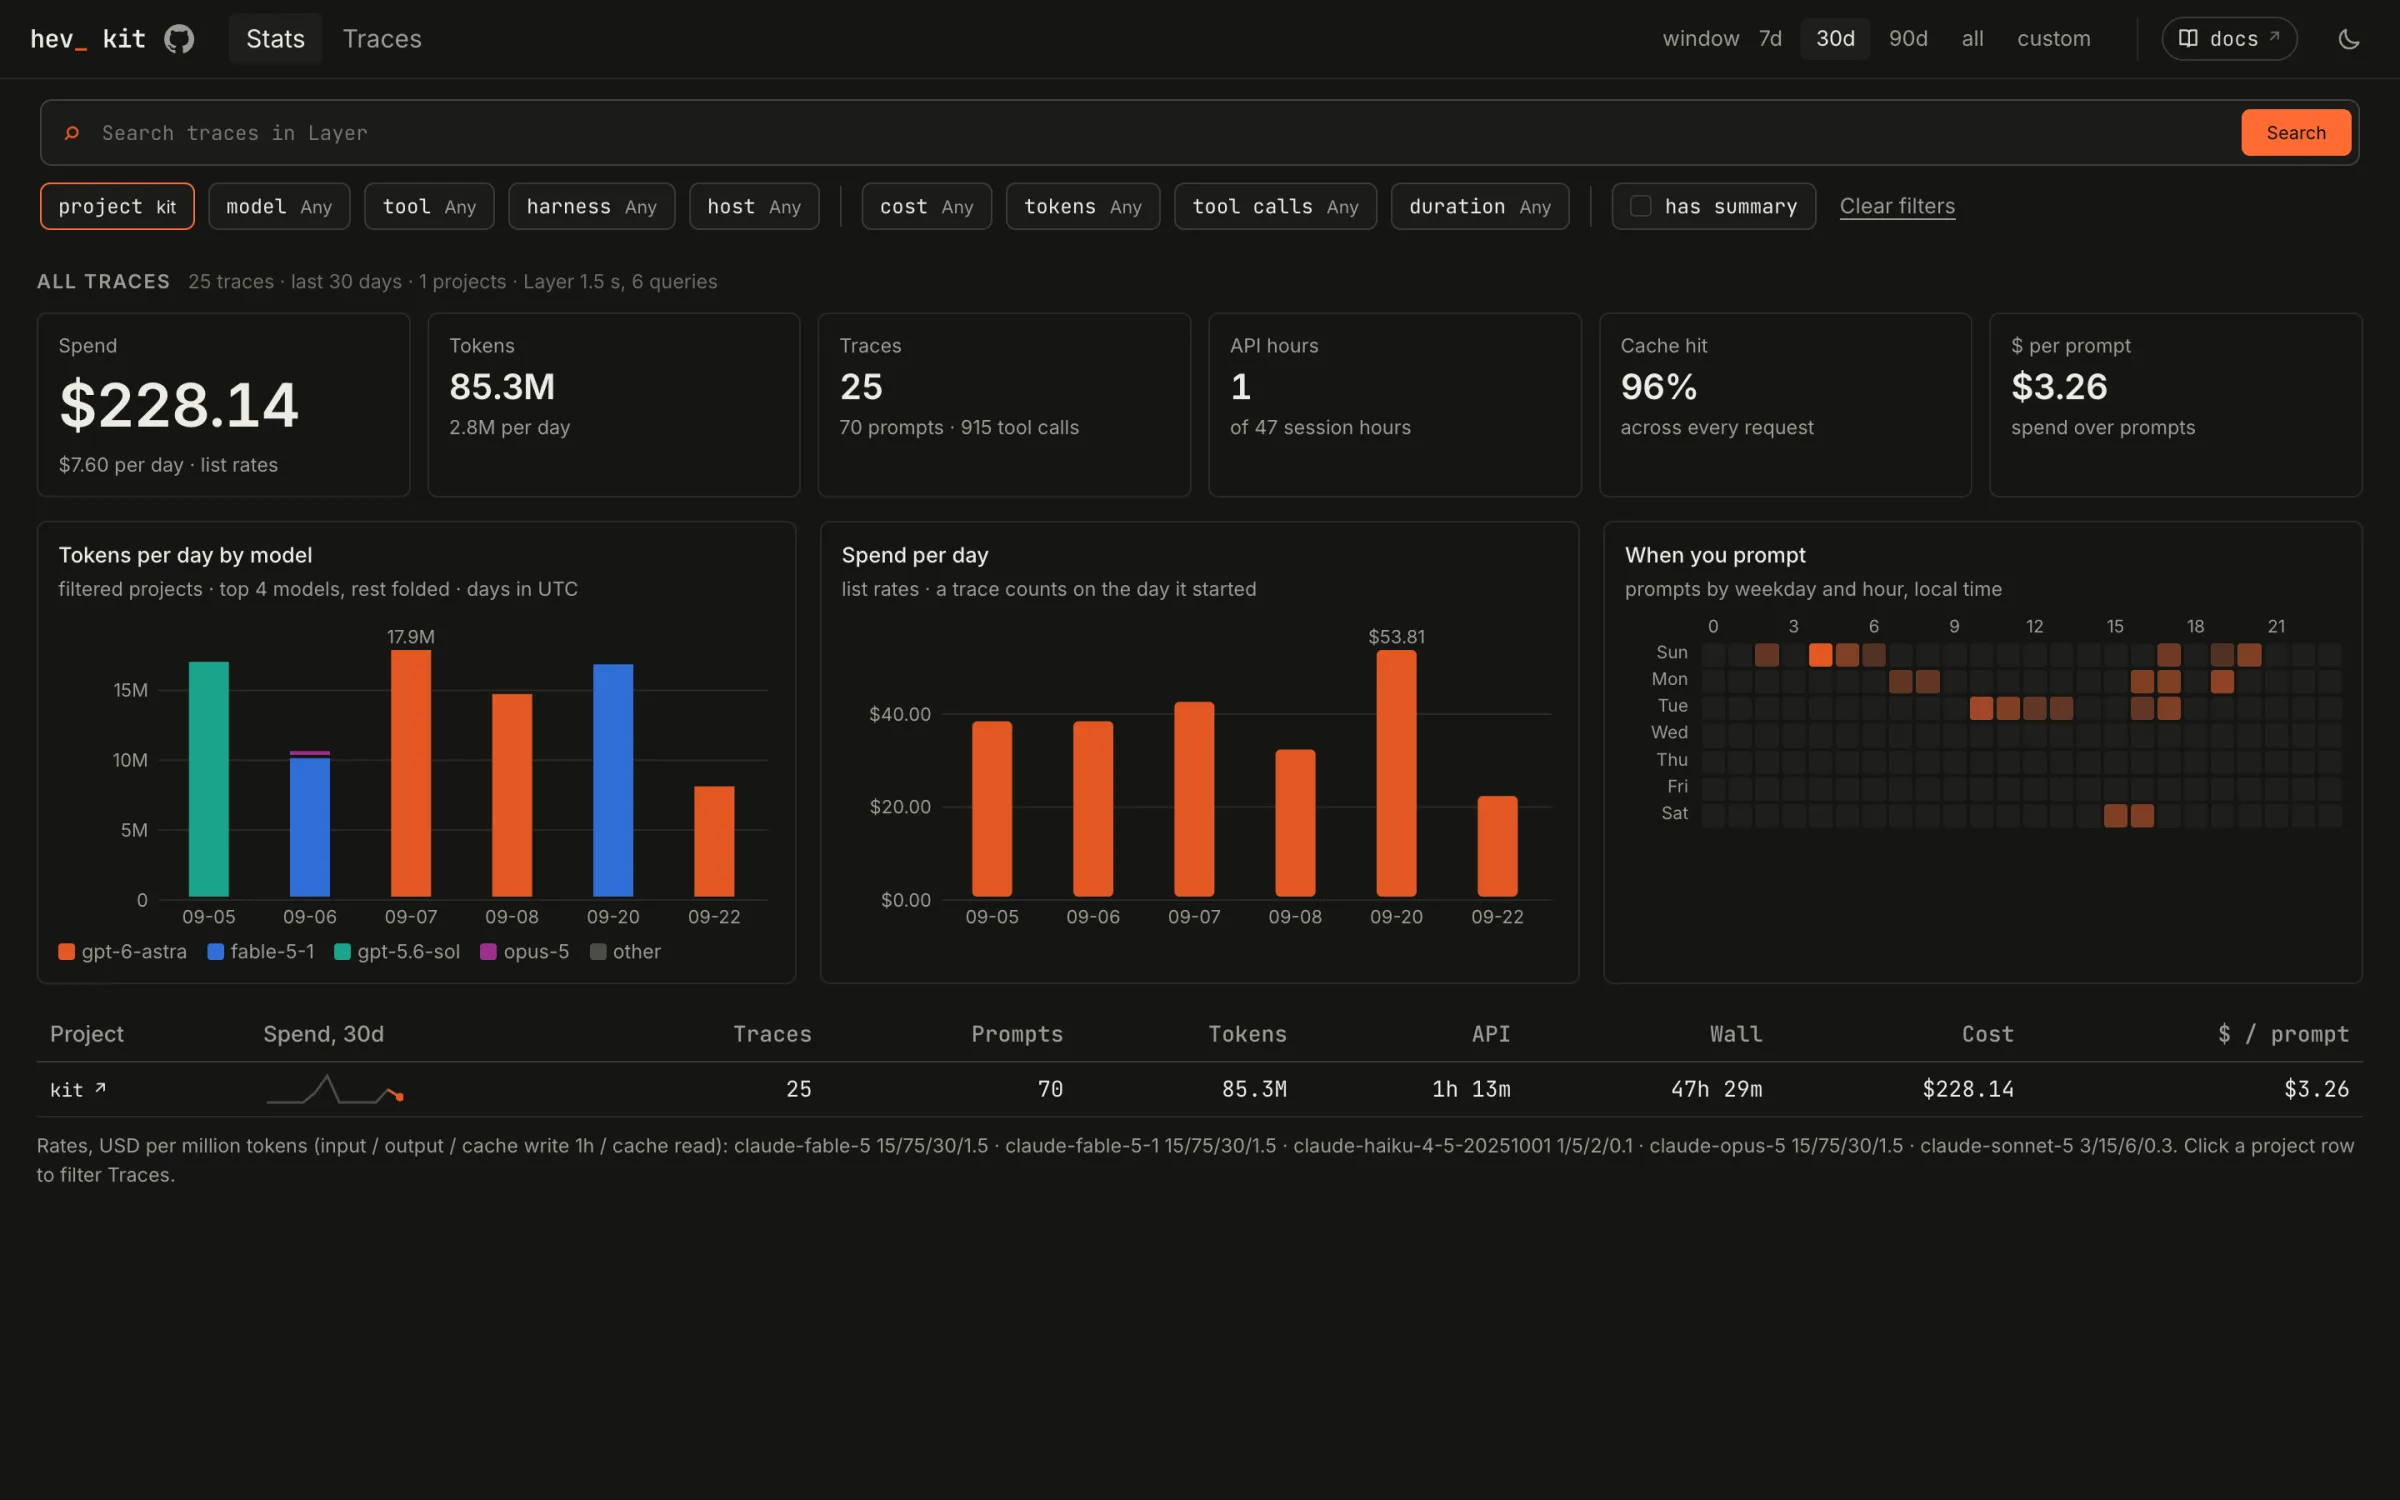
Spend, tokens and cache hits across every trace, by day and by model, at list rates. The heatmap shows when you actually prompt.
Hosted archives
With a turbopuffer key, the archive lives in a namespace in your account. kit
hosts nothing and keeps no copy. hev open opens a hosted archive in the
browser, and hev join CODE joins one you were invited to.
Sensitive data
Coding-agent sessions hold whatever the agent saw: keys pasted into a prompt, secrets on a command line, file contents, customer data. hevd indexes every session in the sources above on each machine it runs on.
kit scrubs secrets before anything is written. Scrubbing is on unless you set
redact = false under [capture]. It uses the gitleaks rule set plus rules for
common API tokens, private keys, JWTs, credentials in URLs and high-entropy
assignments, and replaces each match with a fingerprint. It cannot catch every
password, encoded secret or split token, and the source transcripts on disk stay
raw.
Run hevd on machines whose sessions you are comfortable storing in the archive,
and treat the namespace, its key and any bound hev serve address with the
same care as the transcripts.